Prototyping a Project Management App - Part 3
So, already, we have two different views that we've used to visualize our recipe. No doubt we could keep going and come up with several others. Perhaps the key to making our app useful is to make sure that however we go about building it, we make sure that the core data structure can support a number of different views. From there we can prototype a number of different views and either settle on the one that is most useful, or even design our product to support several views if we decide that is necessary.
Let's start with the simple flow chart view first. It would be nice to build a mobile app, but I think for any fairly complex projects, people will be using a laptop or similar device. Let's start with a website and then, if we want to add a mobile app, we can use one of the many hybrid platforms to re-use a good amount of the javascript and HTML.
For our flow chart, we're going to want to be able to render boxes and shapes and basic text. Once we get to prettying up our product we may also want to add some simple animation. There are a few different ways of doing this in a browser but one of the best ways (and something I have worked with before) is to use a library called D3.js. D3 works to build SVG (Scalable Vector Graphics) objects in the browser. D3 is supported by most browsers, with the exception being very old versions of Internet Explorer (< 9.0). I have also tested it in mobile applications and it works pretty well.
As we start to prototype, it's often a good idea to start by planning out some of the core functions that we'll need. Once we have a set of functions we can begin to flesh them out, either just by writing pseudo-code or basic comments about the series of steps that each function should take.
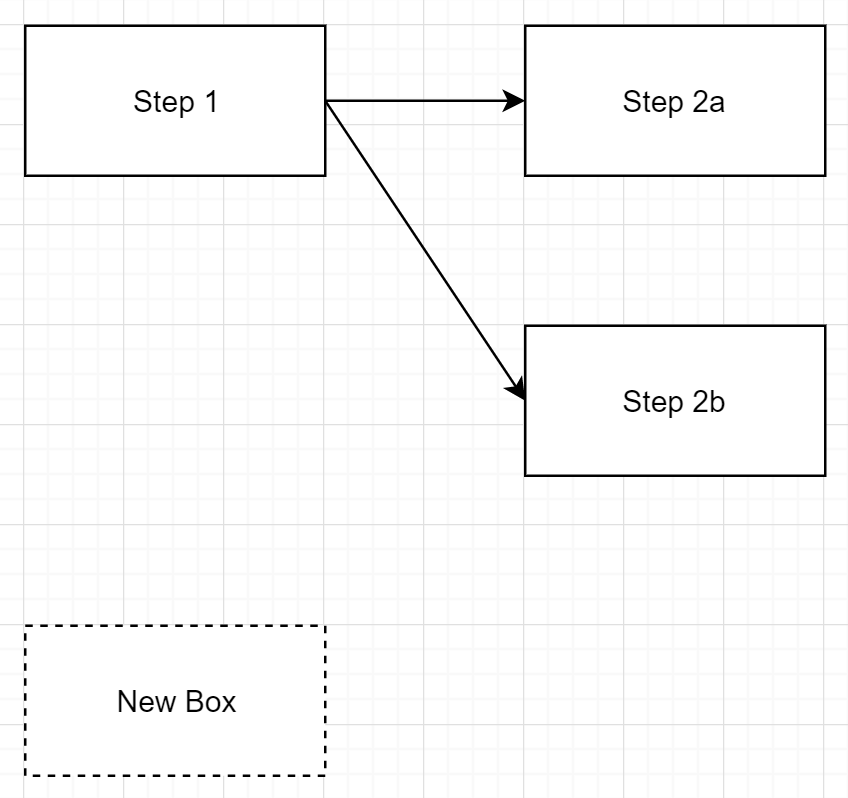
For our simple flow chart concept we know we will want to render some boxes and then some arrows to connect them together. That already gives us two core functions "renderBox" and "renderArrow". Let's start with those and then extend things from there.
For most shapes in D3 it's typical to use x and y coordinates to define the positioning of shapes. For our box, we'll need to provide the x and y starting point for the box and then the width and height (in pixels) for the size of the box. D3 makes drawing a rectangle pretty simple. Filling in some code, the "renderBox" function becomes:
D3 makes use of standard CSS selectors to find DOM elements. This allows us to find an existing "svg" element in our HTML page. Once we have our "svgCanvas" element, we add a rectangle to it and set the attributes of the rectangle. Without setting any other attributes, our rectangle will be a solid black box. We'll probably want to change this at some point but let's leave this alone for now.
Moving on to "renderArrow", let's first deal with drawing a line before we look into arrow heads.
Again, this is fairly straight forward. D3 allows us to add a "line" object that just needs us to provide the starting coordinates (x1,y1) and ending coordinates (x2,y2). Lines in D3 also need us to provide values for the attributes "stroke-width" and "stroke". These allow us to set how wide our line should be as well as what color it should be.
On to arrow heads. D3 supports adding arrow heads to lines using the "marker-end" attribute. As this amusing example demonstrates, D3 is flexible enough to support any shape as a marker end (even turtles!). It looks like all we need to do is define a triangle shape and then refer the "marker-end" attribute to our triangle definition.
There is quite a lot going on here, but let's look at the important parts. Firstly, we're making use of a cool feature of SVG called a "defs" element. This is an element that we can use to store definitions of shapes or other SVG objects. These definitions act as templates but are not rendered until they are referenced from elsewhere in our code. Once we have a "defs" element, we go ahead an define a template for a "marker" and set its id to "arrowHead". This means that we can refer back to it later on by using the syntax "url(#arrowHead)". You can see that that is exactly what we do on the very last line of the code, setting the "marker-end" attribute to point to our template.
Note: We should probably move the code that adds our template to the "defs" element out of the "renderArrow" function, otherwise we'll keep unnecessarily re-defining this template every time we need to draw an arrow. We should only need to define our template once (perhaps on entry into our page). This is something we can take care of as we continue to extend and refactor our code.
Let's start with the simple flow chart view first. It would be nice to build a mobile app, but I think for any fairly complex projects, people will be using a laptop or similar device. Let's start with a website and then, if we want to add a mobile app, we can use one of the many hybrid platforms to re-use a good amount of the javascript and HTML.
For our flow chart, we're going to want to be able to render boxes and shapes and basic text. Once we get to prettying up our product we may also want to add some simple animation. There are a few different ways of doing this in a browser but one of the best ways (and something I have worked with before) is to use a library called D3.js. D3 works to build SVG (Scalable Vector Graphics) objects in the browser. D3 is supported by most browsers, with the exception being very old versions of Internet Explorer (< 9.0). I have also tested it in mobile applications and it works pretty well.
As we start to prototype, it's often a good idea to start by planning out some of the core functions that we'll need. Once we have a set of functions we can begin to flesh them out, either just by writing pseudo-code or basic comments about the series of steps that each function should take.
For our simple flow chart concept we know we will want to render some boxes and then some arrows to connect them together. That already gives us two core functions "renderBox" and "renderArrow". Let's start with those and then extend things from there.
var renderBox = function (x, y, width, height) {
    // select the existing SVG container that we named "svgCanvas"

    // draw a rectangle using the x, y, width and height variables to set its attributes
}

var renderArrow = function (x1, y1, x2, y2) {
    // select the existing SVG container that we named "svgCanvas"

    // draw a line starting at point x1,y1 and ending at point x2,y2

    // figure out how to draw an arrow head
}
For most shapes in D3 it's typical to use x and y coordinates to define the positioning of shapes. For our box, we'll need to provide the x and y starting point for the box and then the width and height (in pixels) for the size of the box. D3 makes drawing a rectangle pretty simple. Filling in some code, the "renderBox" function becomes:
var renderBox = function (x, y, width, height) {
    // select the existing SVG container that we named "svgCanvas"
    var svgCanvas = d3.select("#svgCanvas");
    // draw a rectangle using the x, y, width and height variables to set its attributes
    var box = svgCanvas
        .append("rect")
        .attr("x", x)
        .attr("y", y)
        .attr("width", width)
        .attr("height", height)
}
D3 makes use of standard CSS selectors to find DOM elements. This allows us to find an existing "svg" element in our HTML page. Once we have our "svgCanvas" element, we add a rectangle to it and set the attributes of the rectangle. Without setting any other attributes, our rectangle will be a solid black box. We'll probably want to change this at some point but let's leave this alone for now.
Moving on to "renderArrow", let's first deal with drawing a line before we look into arrow heads.
var renderArrow = function (x1, y1, x2, y2) {
 // select the existing SVG container that we named "svgCanvas"
 var svgCanvas = d3.select("#svgCanvas");
 // draw a line starting at point x1,y1 and ending at point x2,y2
 svgCanvas.append('line')
  .attr("x1", x1)
  .attr("y1", y1)
  .attr("x2", x2)
  .attr("y2", y2)
  .attr("stroke-width", 2)
  .attr("stroke", "black")
 // figure out how to draw an arrow head
}
Again, this is fairly straight forward. D3 allows us to add a "line" object that just needs us to provide the starting coordinates (x1,y1) and ending coordinates (x2,y2). Lines in D3 also need us to provide values for the attributes "stroke-width" and "stroke". These allow us to set how wide our line should be as well as what color it should be.
On to arrow heads. D3 supports adding arrow heads to lines using the "marker-end" attribute. As this amusing example demonstrates, D3 is flexible enough to support any shape as a marker end (even turtles!). It looks like all we need to do is define a triangle shape and then refer the "marker-end" attribute to our triangle definition.
var renderArrow = function (x1, y1, x2, y2) {
 // select the existing SVG container that we named "svgCanvas"
 var svgCanvas = d3.select("#svgCanvas");
 // add a "defs" element to our svg
        // (defs are like templates, not rendered immediately)
 var defs = svgCanvas.append("defs");
 // add a definition for an arrow head that can be used as a marker
 defs.append("marker")
  .attr("id", "arrowHead")
  .attr("viewBox", "0 -5 10 10")
  .attr("refX", 5)
  .attr("refY", 0)
  .attr("markerWidth", 10)
  .attr("markerHeight", 10)
  .attr("orient", "auto")
  .append("path")
  .attr("d", "M0,-5L10,0L0,5");
 // draw a line starting at point x1,y1 and ending at point x2,y2
 svgCanvas.append('line')
  .attr("x1", x1)
  .attr("y1", y1)
  .attr("x2", x2)
  .attr("y2", y2)
  .attr("stroke-width", 2)
  .attr("stroke", "black")
  // use the syntax "url(#templateId)" to point to the "arrowHead"
  // template defined above in defs
  .attr("marker-end", "url(#arrowHead)")
}
There is quite a lot going on here, but let's look at the important parts. Firstly, we're making use of a cool feature of SVG called a "defs" element. This is an element that we can use to store definitions of shapes or other SVG objects. These definitions act as templates but are not rendered until they are referenced from elsewhere in our code. Once we have a "defs" element, we go ahead an define a template for a "marker" and set its id to "arrowHead". This means that we can refer back to it later on by using the syntax "url(#arrowHead)". You can see that that is exactly what we do on the very last line of the code, setting the "marker-end" attribute to point to our template.
Note: We should probably move the code that adds our template to the "defs" element out of the "renderArrow" function, otherwise we'll keep unnecessarily re-defining this template every time we need to draw an arrow. We should only need to define our template once (perhaps on entry into our page). This is something we can take care of as we continue to extend and refactor our code.
Comments
Post a Comment